📊
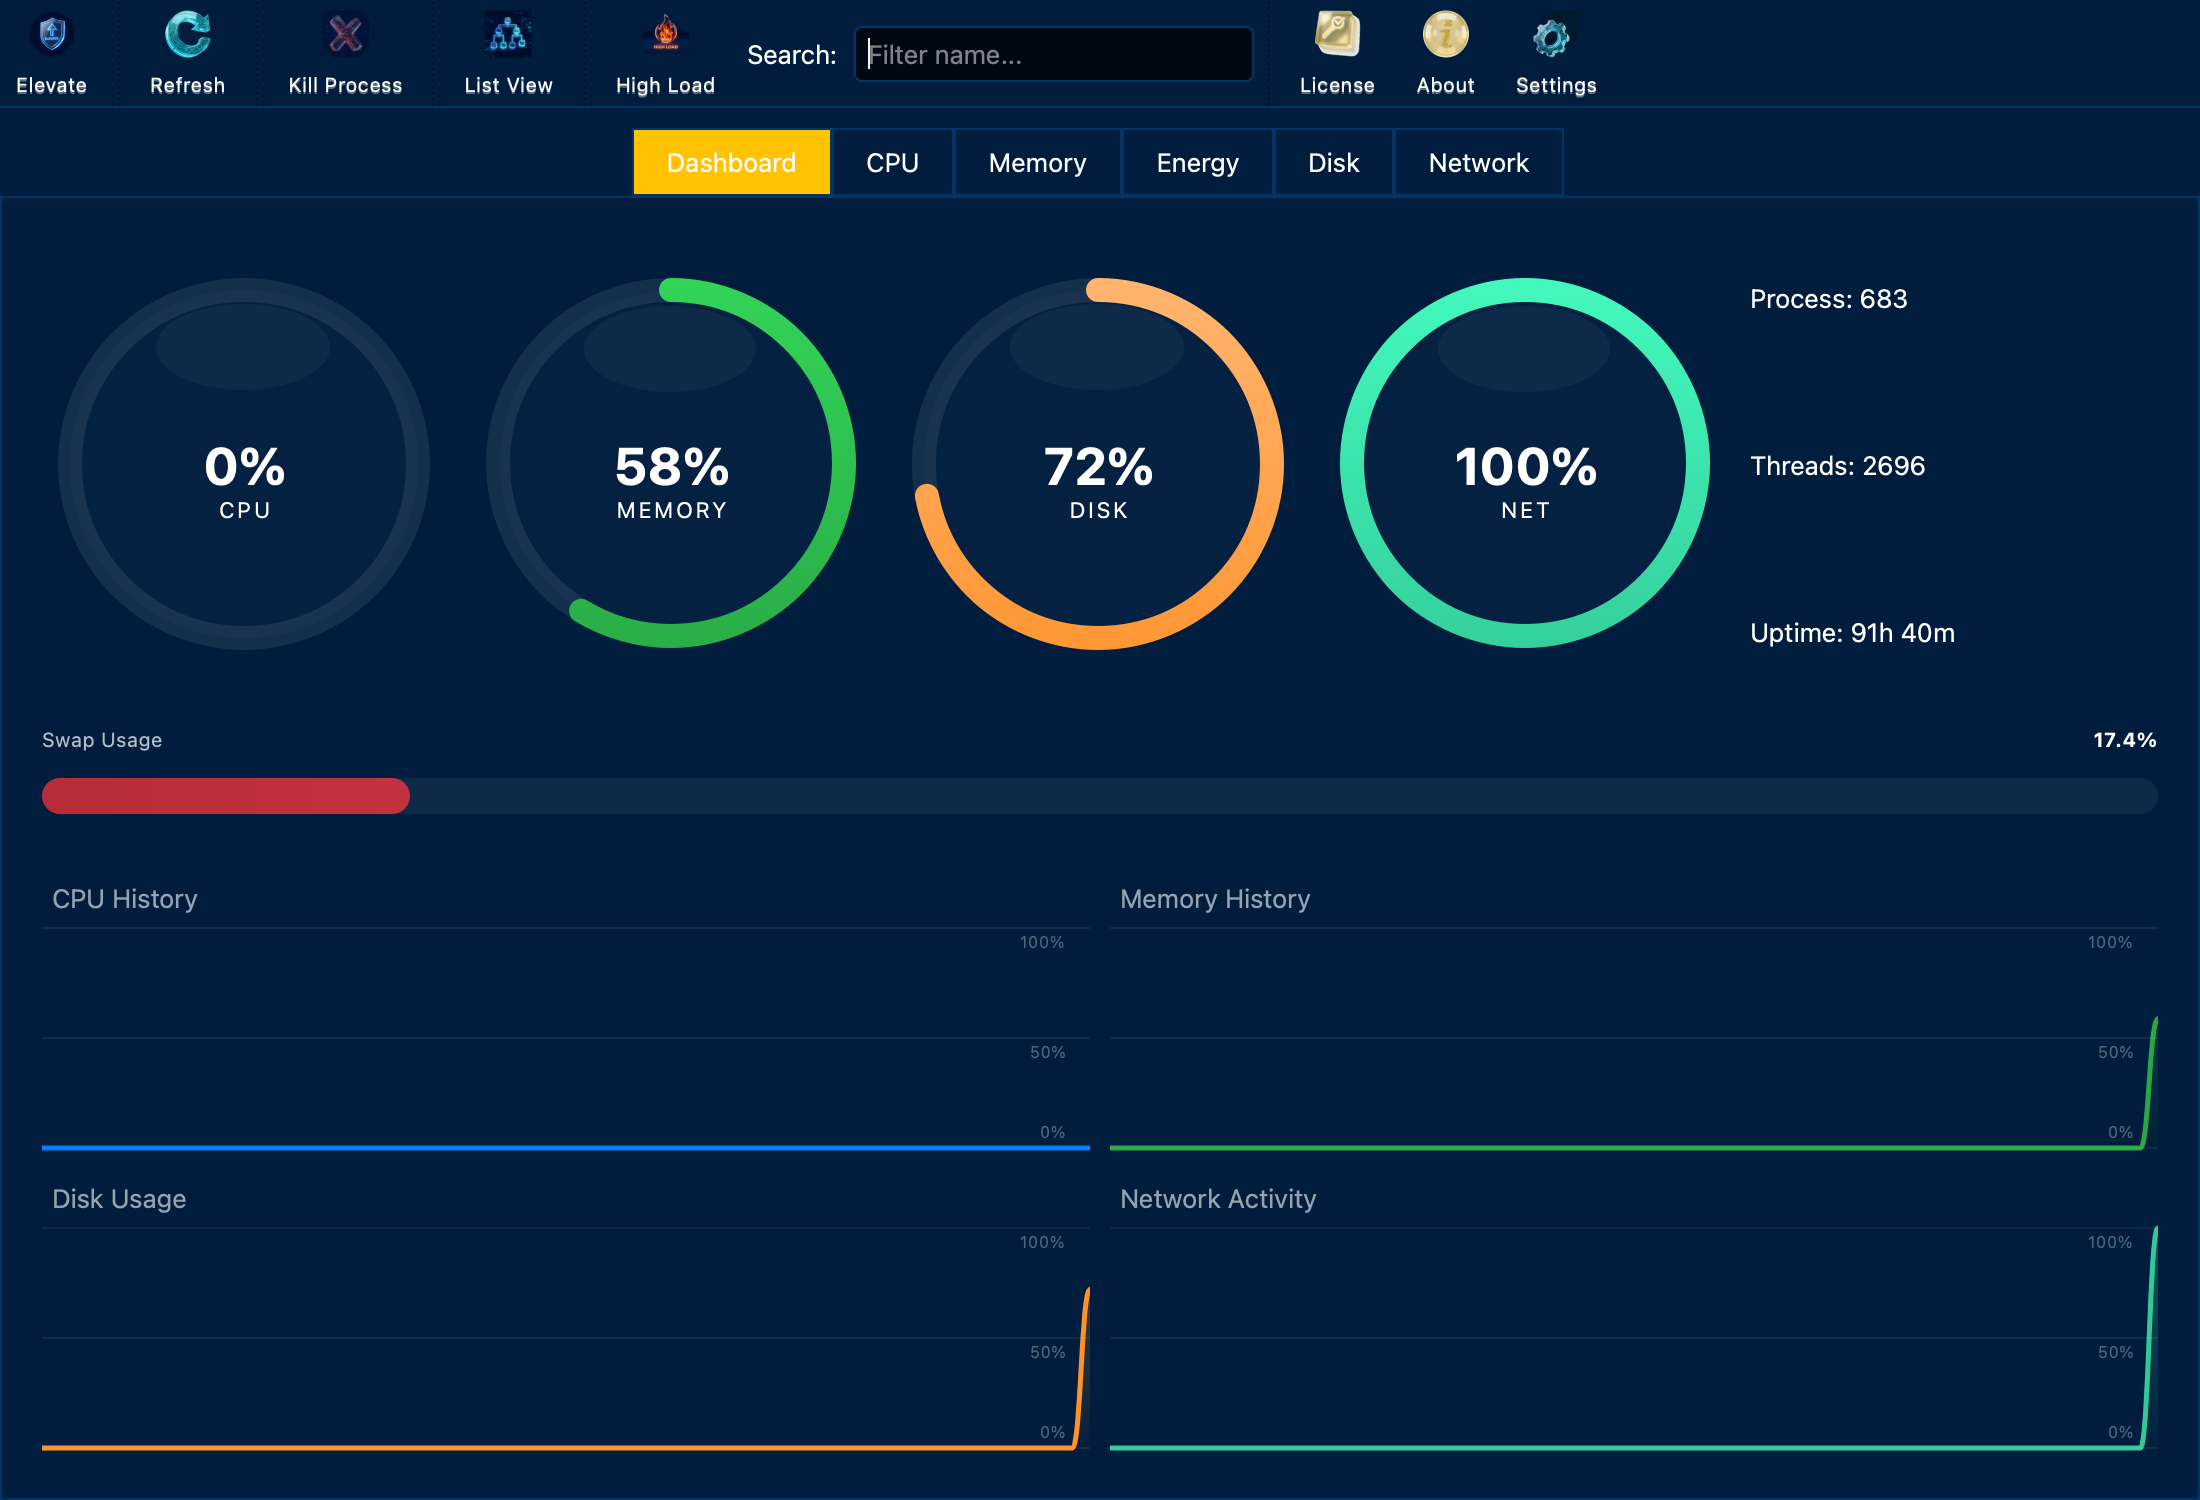
Real-Time System Monitoring
Beautiful circular gauges and line graphs track CPU, Memory, Disk, and Network usage with 60-point
historical data. Click any gauge to jump to detailed analysis.
🔍
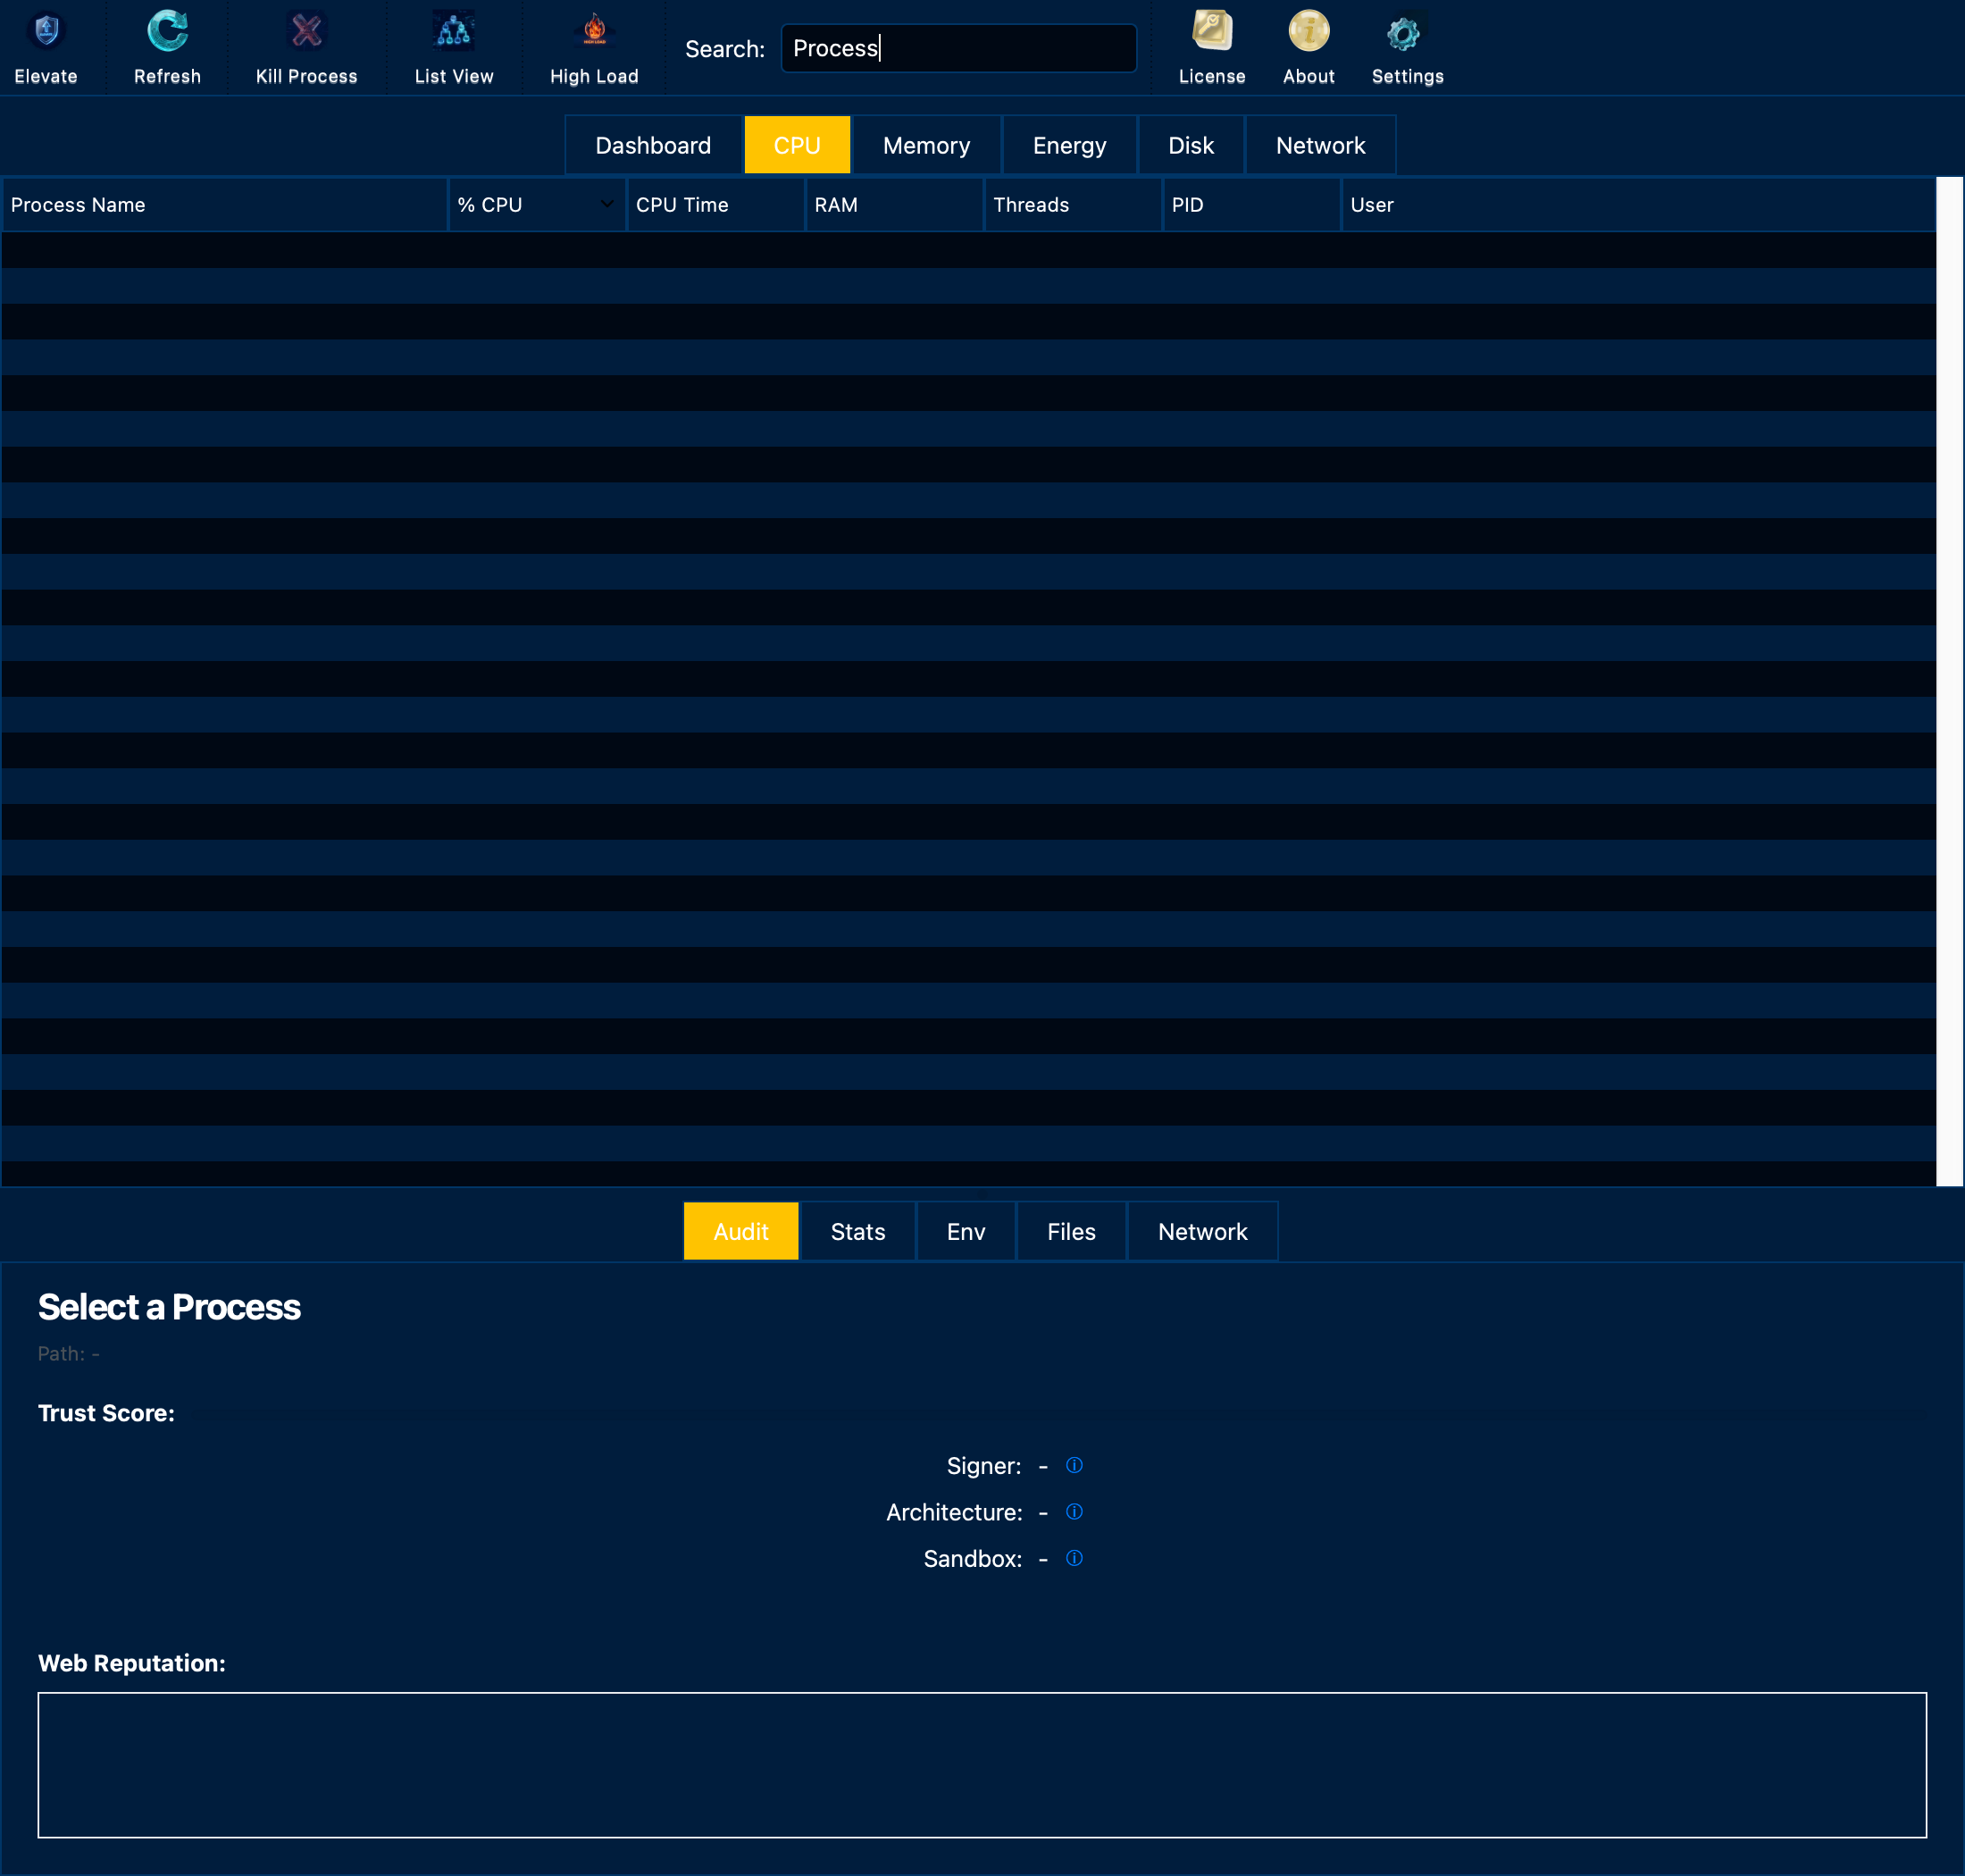
Process Safety Audits
Automatic web-based safety checks for every process. Get instant verdicts on whether a process is
safe, with search summaries and malware detection.
🌐
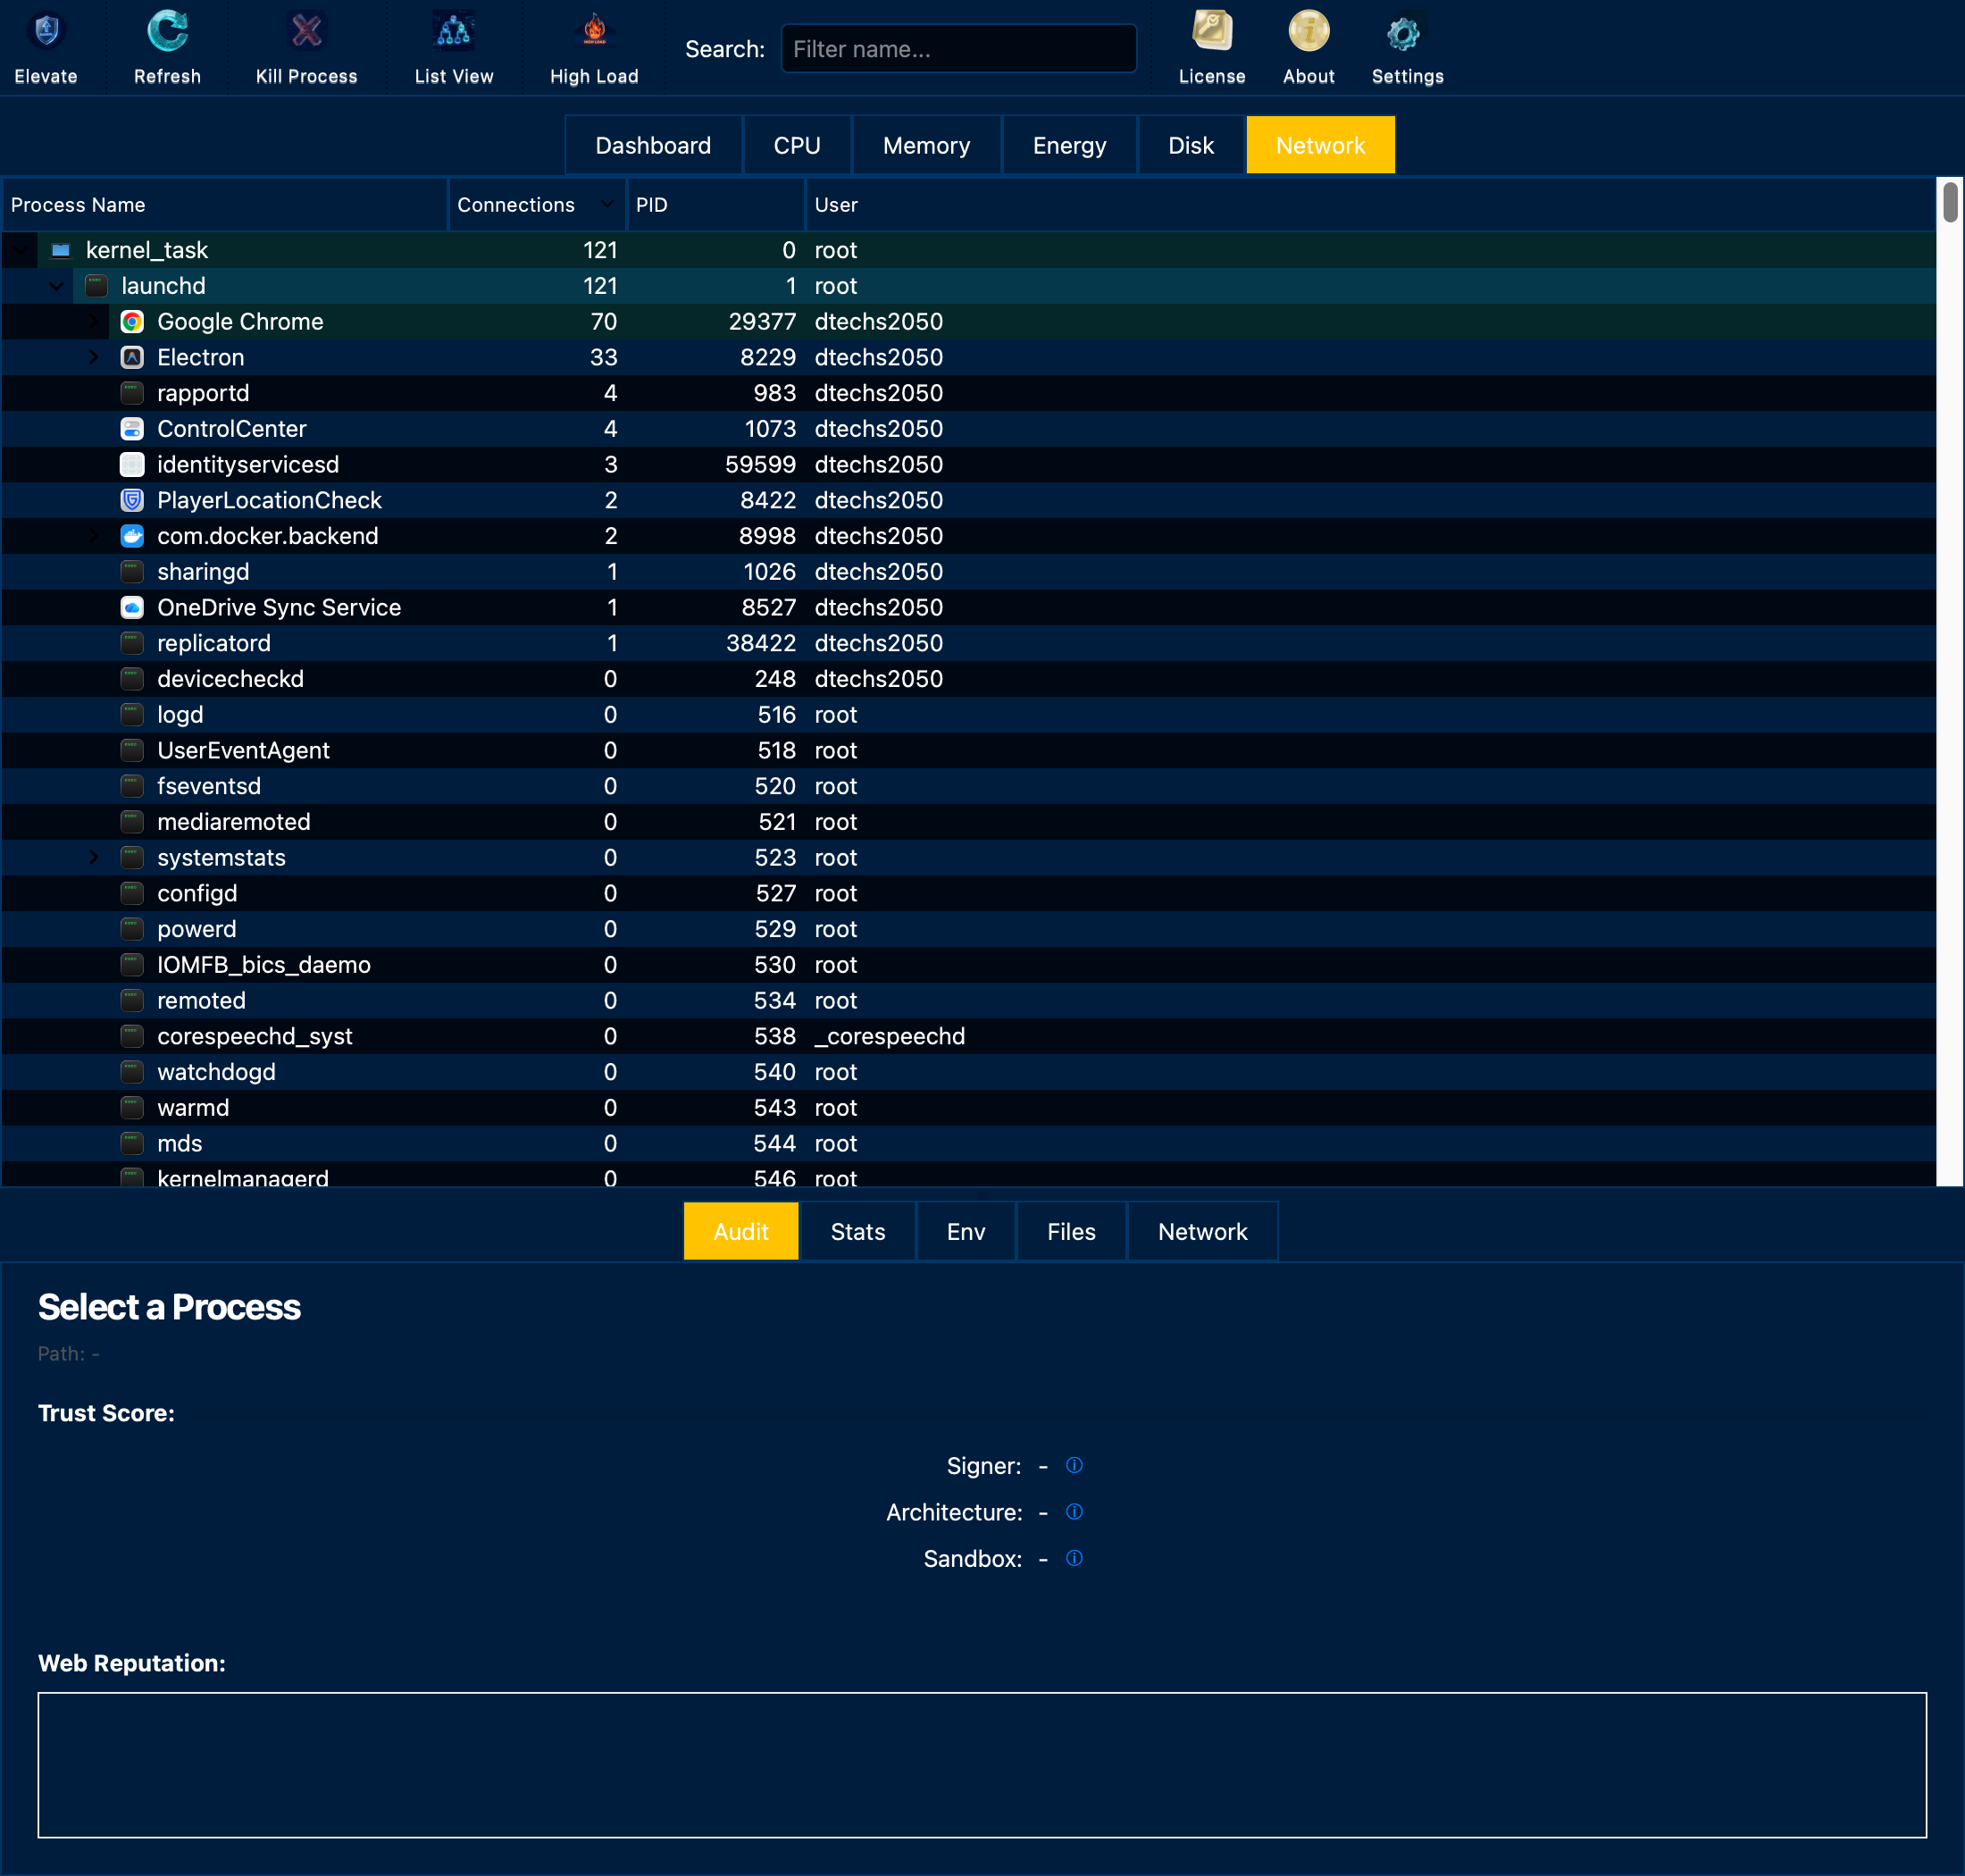
Network Intelligence
See exactly where your data is going. GeoIP lookup shows country flags, cities, and hostnames for
every remote connection. Track open sockets in real-time.
⚡
Smart Icon Resolution
Instantly recognize helper processes. Automatically resolves cryptic child processes to their parent
application icons (e.g., Chrome Helper → Chrome icon).
📈
Sparkline Graphs
30-point CPU and memory history embedded directly in the process table. See performance trends at a
glance without opening separate windows.
🎯
Force Quit Manager
Take control of unresponsive apps. Terminate stubborn processes with SIGTERM or SIGKILL. No more
waiting for OS timeouts.
🌳
Tree View Mode
Visualize parent-child process relationships in a hierarchical tree. Understand process dependencies
and system architecture at a glance.
🔎
Instant Global Search
Real-time process filtering by name or PID. High-impact highlighting automatically marks
resource-heavy processes (CPU >80%, Memory >1GB).
💾
Historical Logging
SQLite database automatically logs high-impact processes (CPU >80%). Review historical performance
issues and identify problematic applications.
🎨
8 Premium Themes
Choose from Midnight Gold, Blue 3D, Charcoal Slate, Coffee Bean, Cyber Orange, Emerald Forest,
Lavender Night, Nordic Snow, and Rose Garden.
⚙️
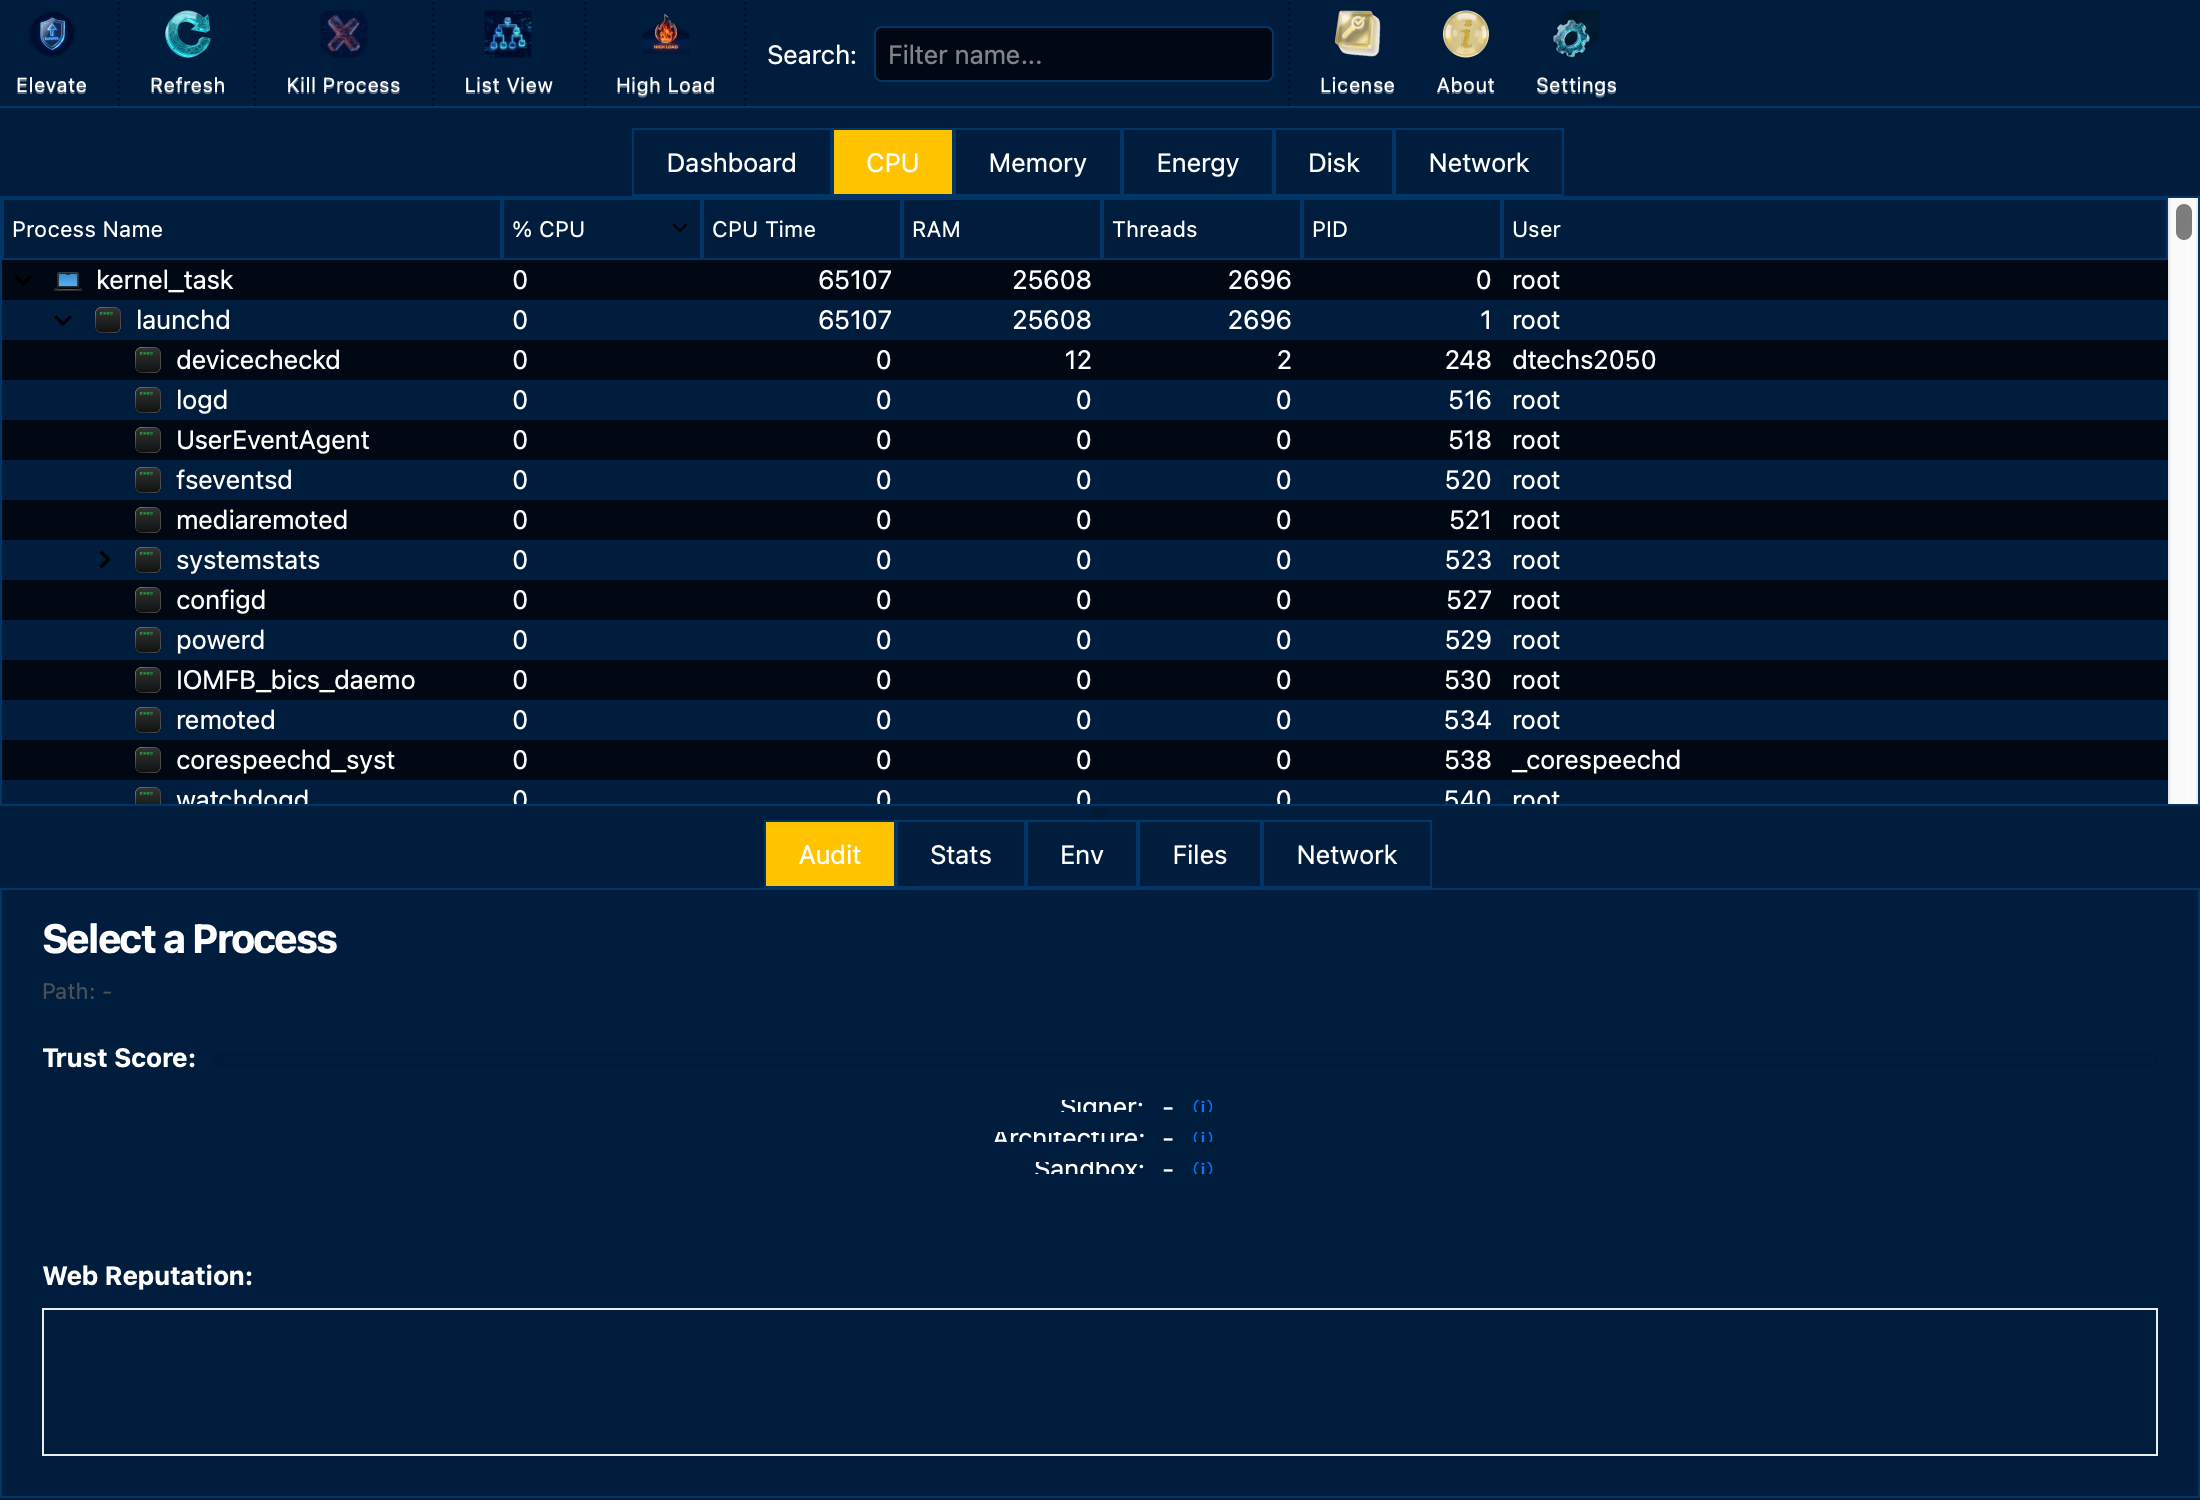
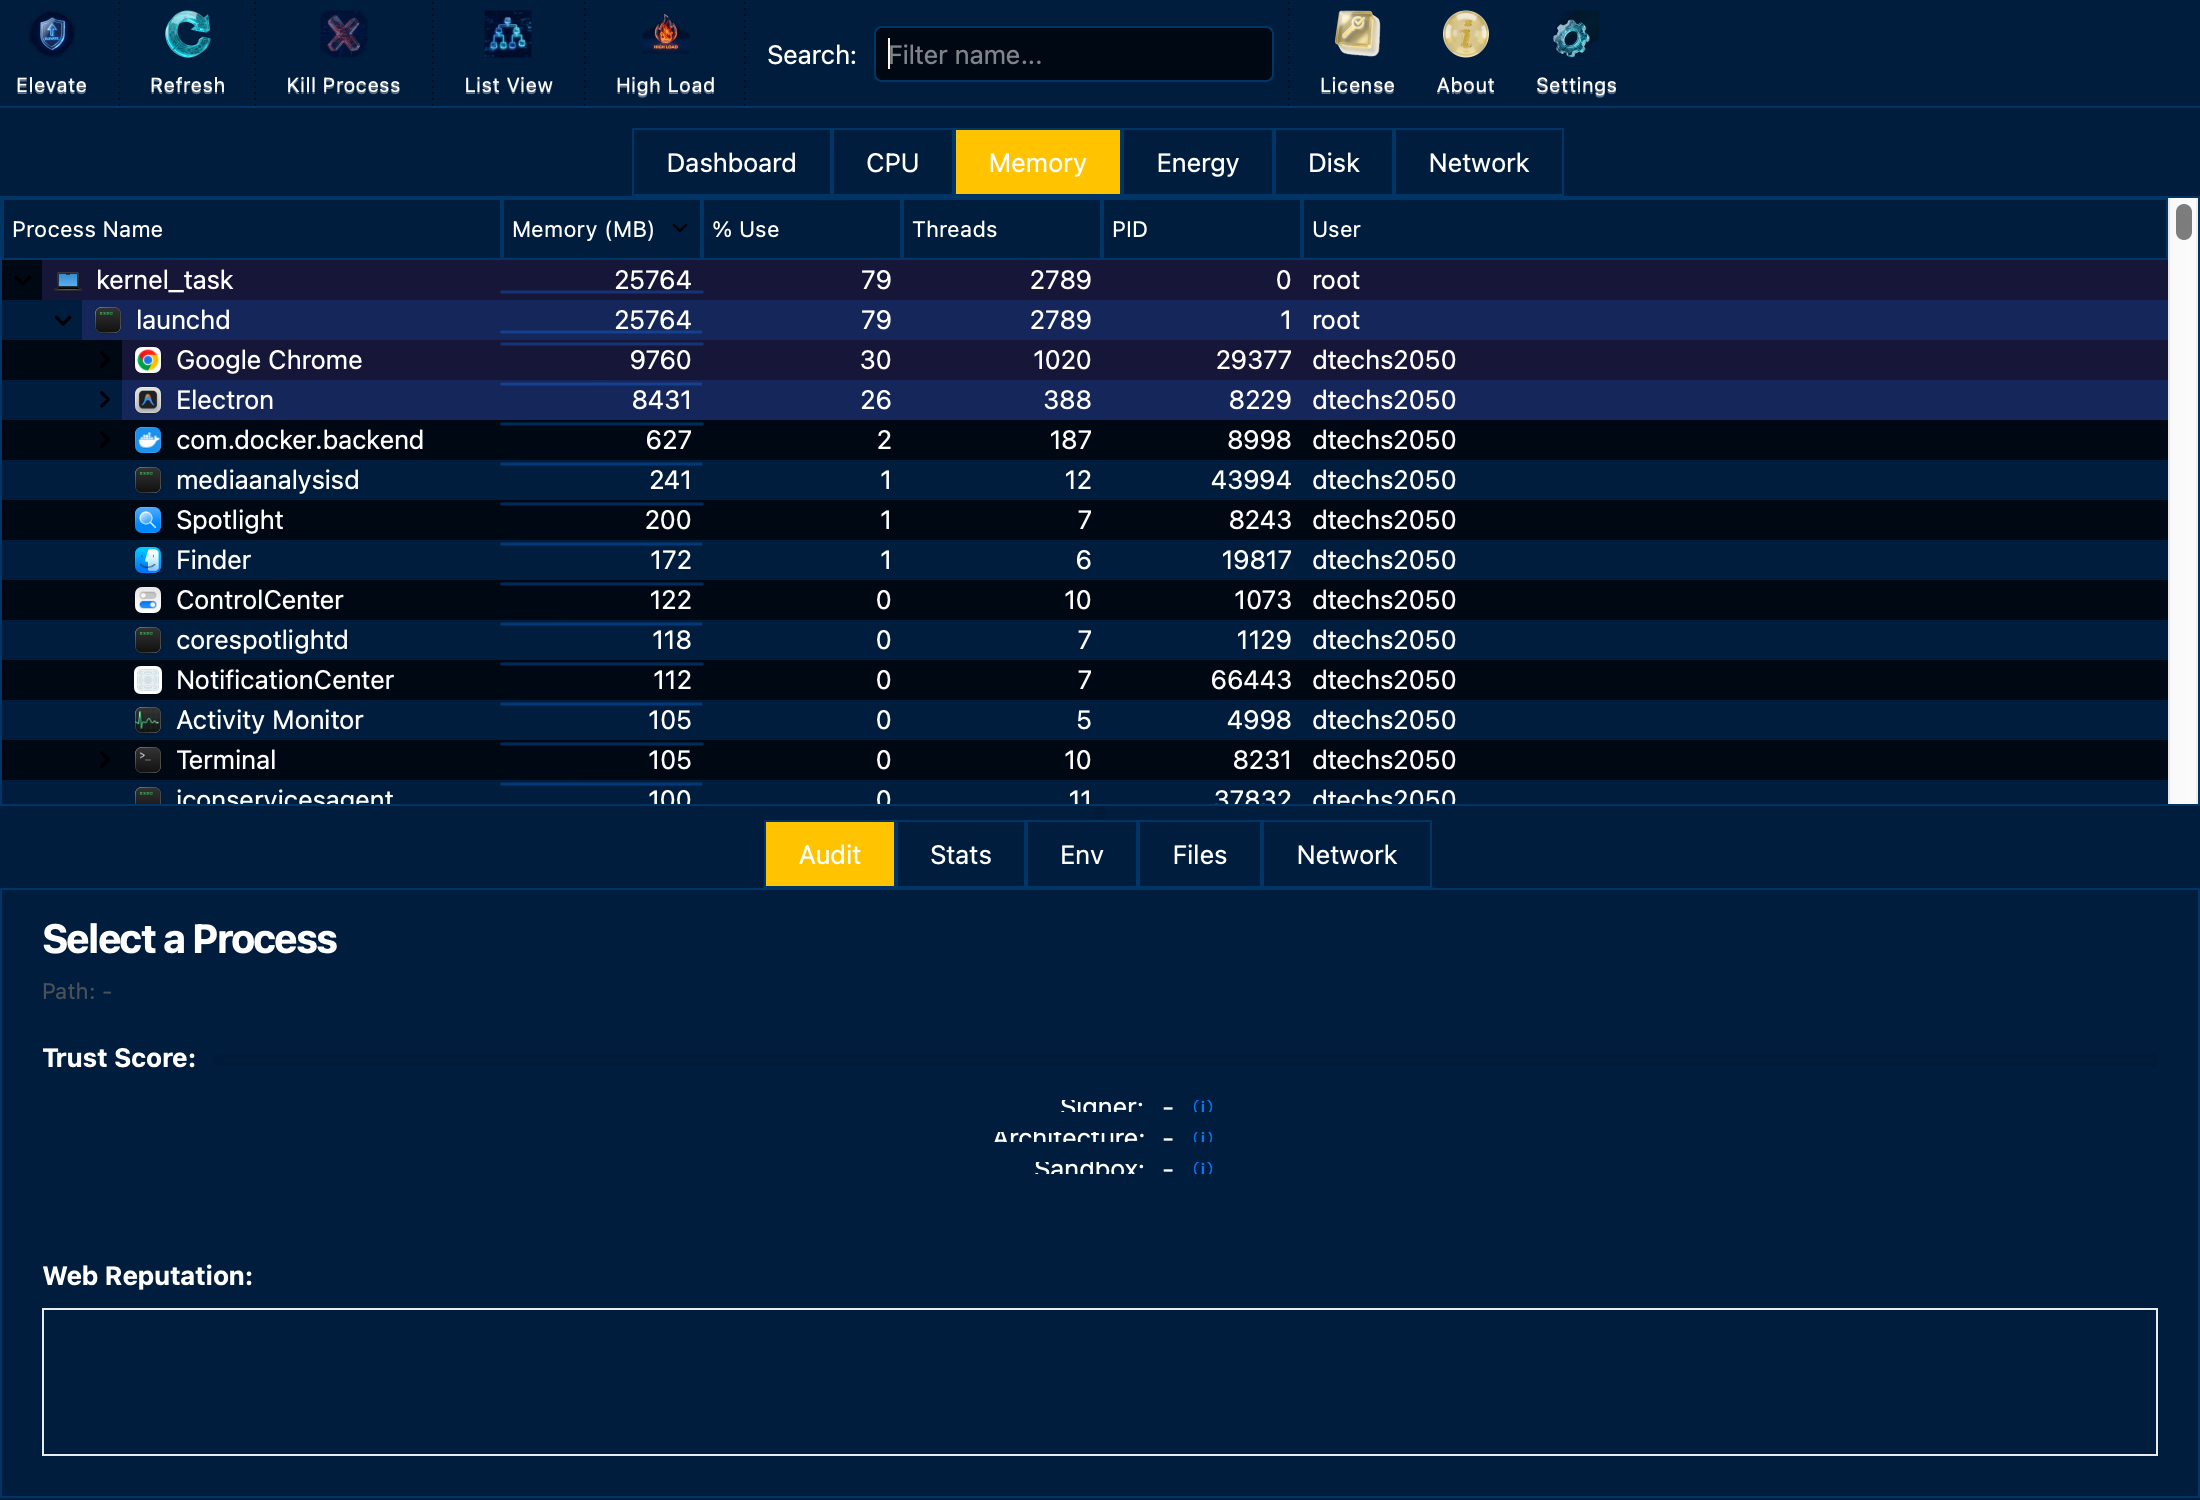
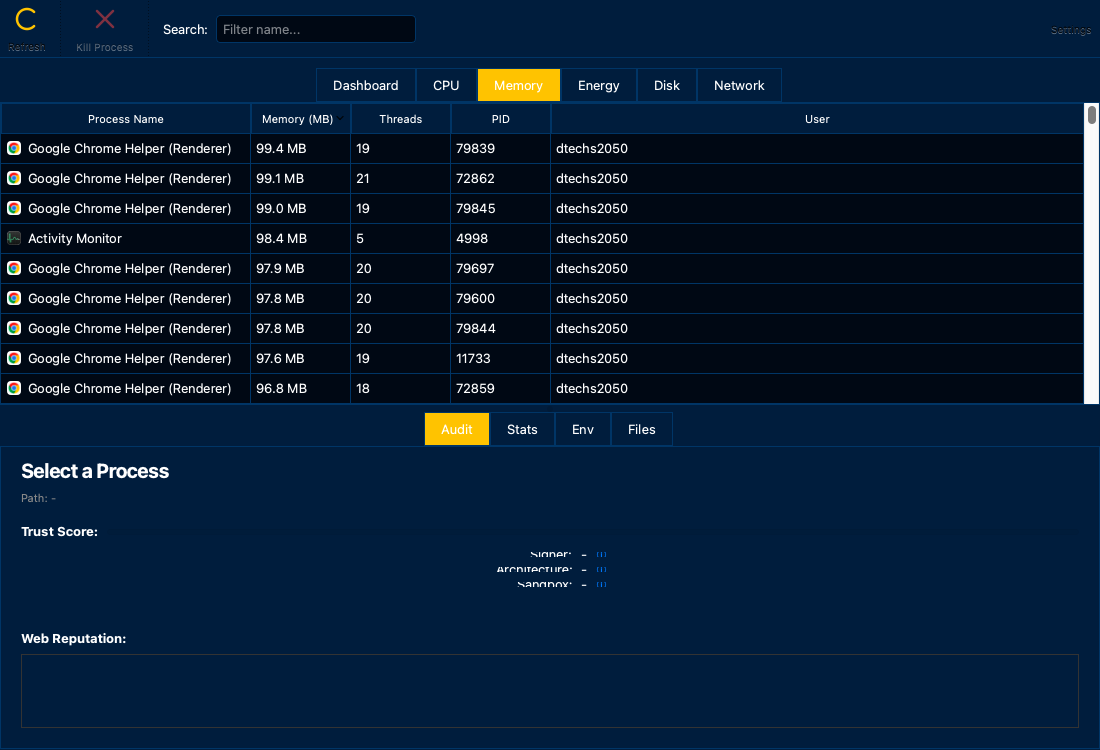
Detailed Process Info
Comprehensive process details: PID, PPID, User, CPU time, Memory (RSS & %), Threads, Status,
Executable path, and active network connections.
🚀
High Performance
Multi-threaded monitoring with 2-second updates. Process caching and smart icon resolution ensure
smooth performance even with 300+ processes.